Key Features of the Report
- Permission-Based Access: Users only see the information they are authorized to view, ensuring data security and compliance.
- Included with Every Project: The report is a standard feature, provided to all customers at no additional cost.
- Data Export Options: Export data from any visual into formats like Excel, PDF, or Word, enabling offline analysis and reporting.
- Real-Time Updates: The report reflects the latest project activity, providing up-to-the-minute accuracy.
- Standardised Design: Ensuring consistency in reporting style across multiple projects

- Tabbed Navigation - Switch seamlessly between pages like Teams, Drawings, Documents, Controllers, and Activity for holistic project management
- Tasks Assigned- View Total Items, Sub Items, and tasks Assigned to Teams or You in real-time
- Project Summary Breakdown -
- Categorised into your organisations key areas such as Quality, HSE, Permits, Firestopping, Damage and many more.
- Each category expands to display the number of items and their current status, indicated by color-coded groups for easy identification (e.g., Open, Draft, Ready for Signoff).
- Status-Based Navigation -
- Clicking on any status opens a detailed list in a new page, allowing you to deep-dive into specific items.
- This feature helps streamline workflows by directing focus to tasks needing immediate attention.
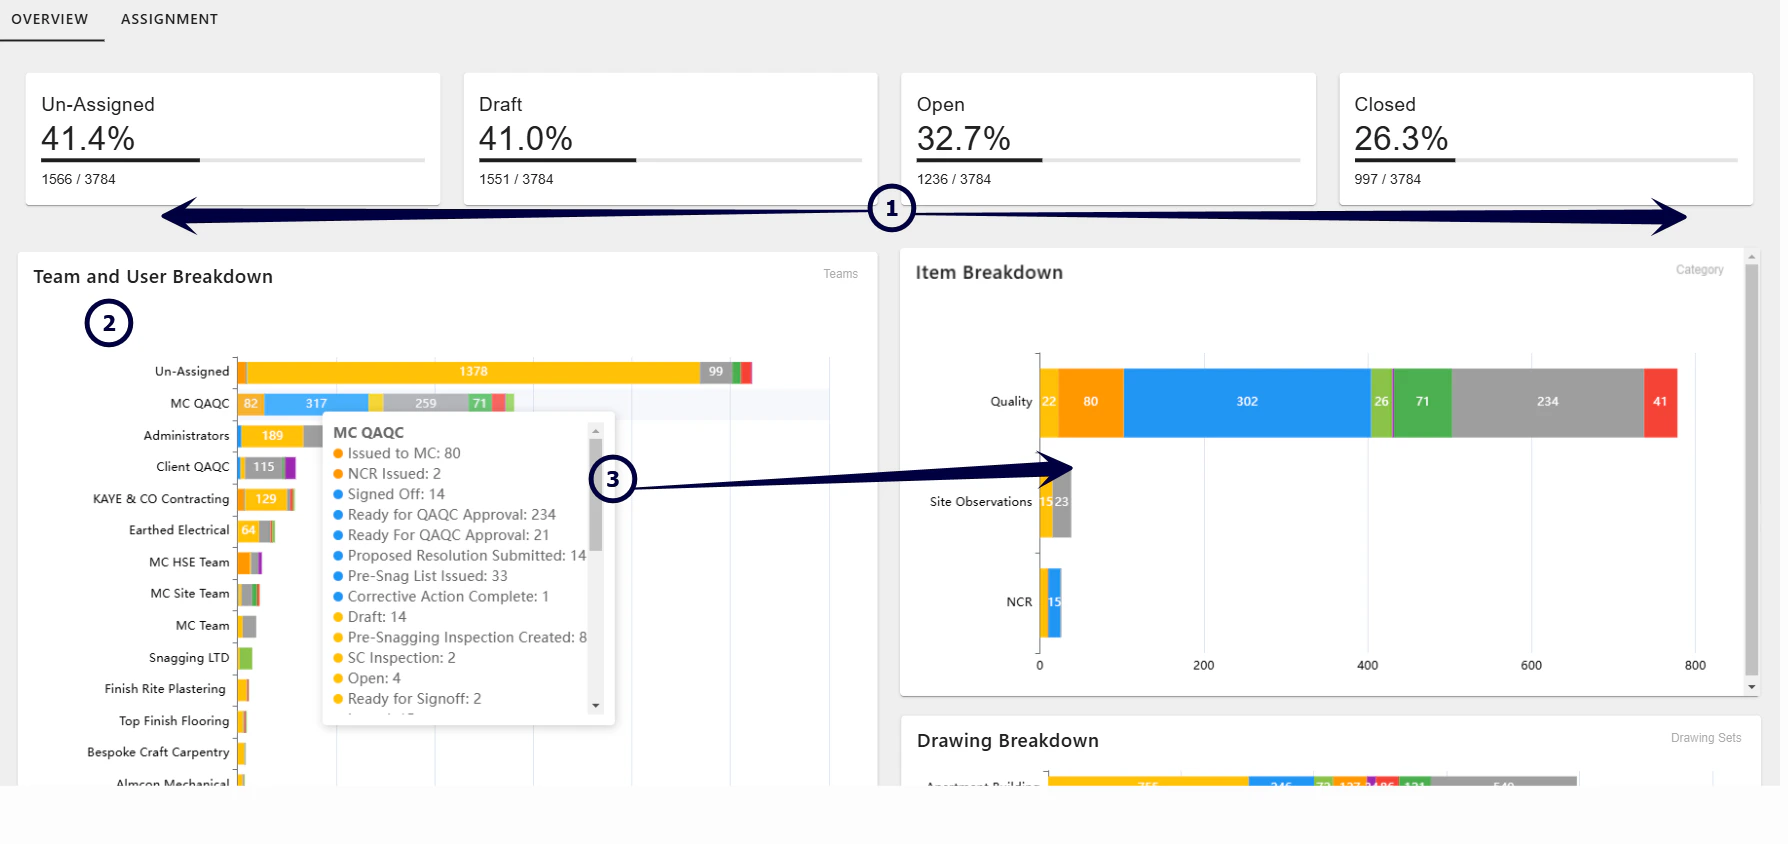
- Overview - showing a breakdown of activty that requires assigning and the progress of currently assigned activities
- Team and User Breakdown -
- Detailed bar charts showcase item distribution among teams and individual users.
- Easily spot unassigned tasks or review workloads to ensure balanced resource allocation
- Interactive Navigation - Select any status or category to drill deeper into the data, allowing for targeted problem-solving and efficient task management.
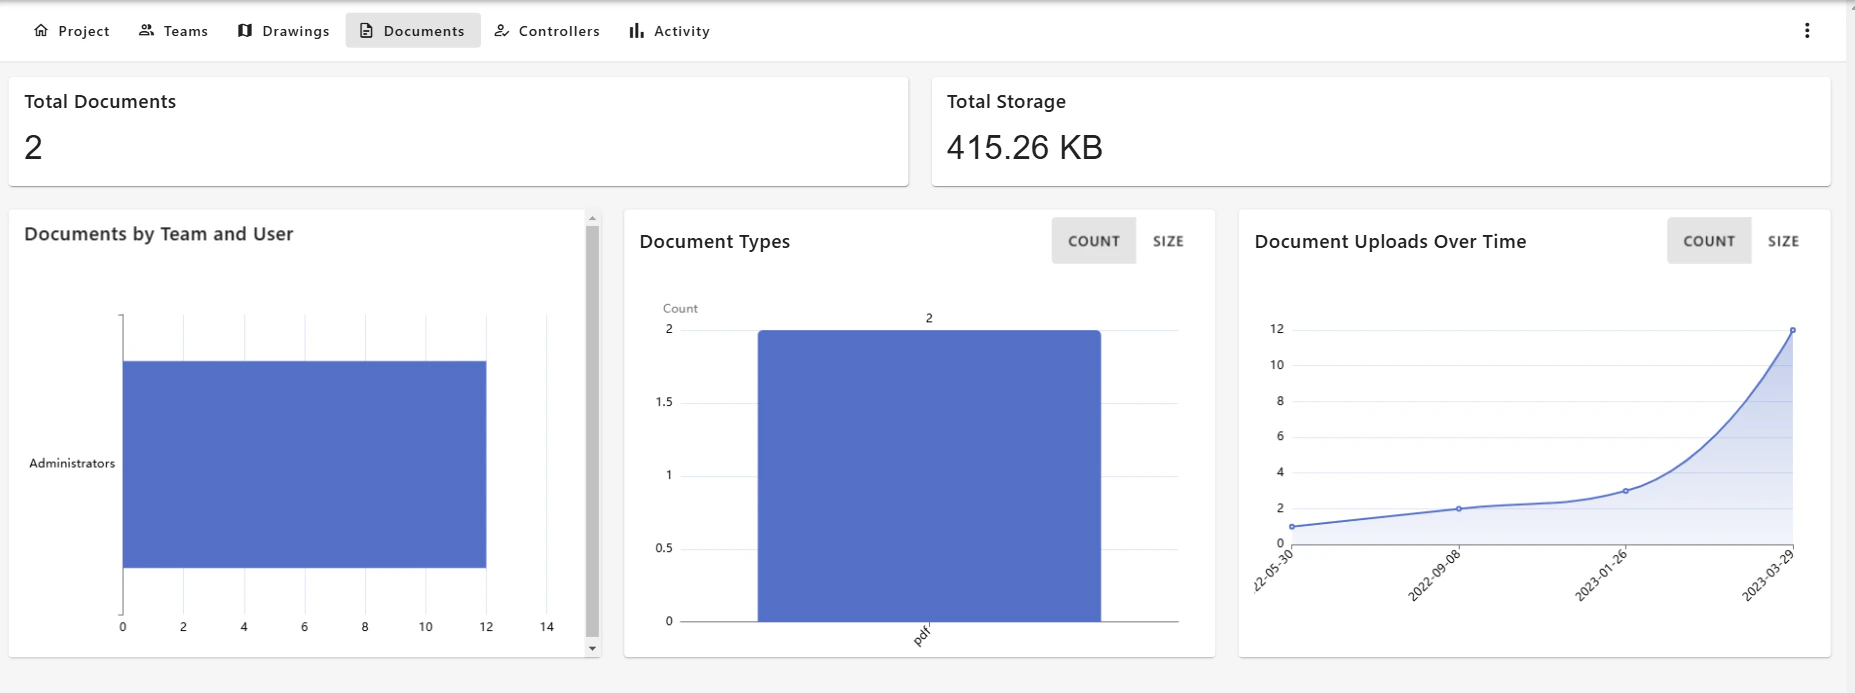
- Access the Documents page to review files stored in the Project Document Repository
- Total Documents uploaded.
- Total Storage used.

- Item Breakdown Chart - Categorizes items (e.g., Quality, Permits, Fire Assessment) and their status using color codes, similar to the Teams page. This allows for quick analysis of each category’s workload and current state.
- Controller Breakdown Pie Chart -
- Visualizes the distribution of controlled items among teams
- For example, percentages for Administrators, QA/QC teams, and other contributors help identify key stakeholders and their roles in project management.

- Activity by Item / Team / Location -
- Displays all activity grouped by Item, Team, and Location.
- Color-coded for easy identification of their current status (e.g., Open, Draft, or Completed).
- Allows you to select specific categories or bars to drill down into detailed data, such as individual items or locations contributing to overall activity.
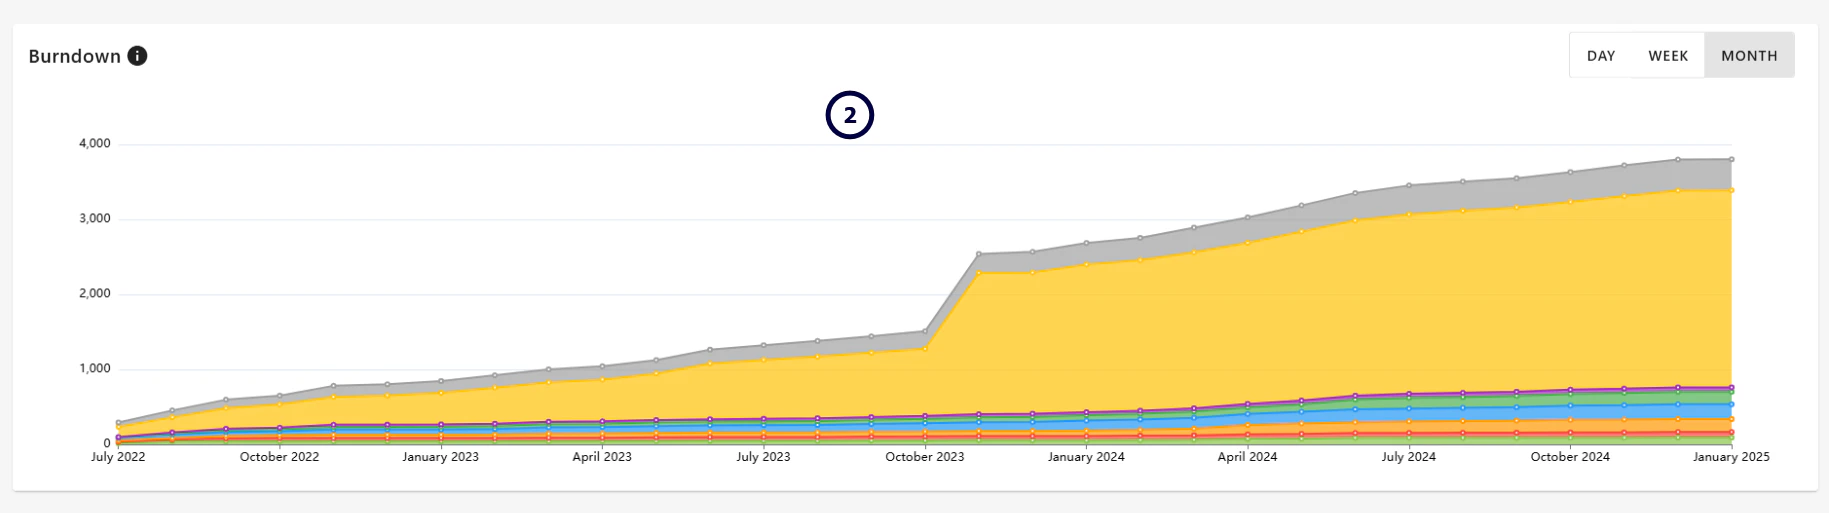
- Burndown Chart - Tracks the accumulation and resolution of items over time
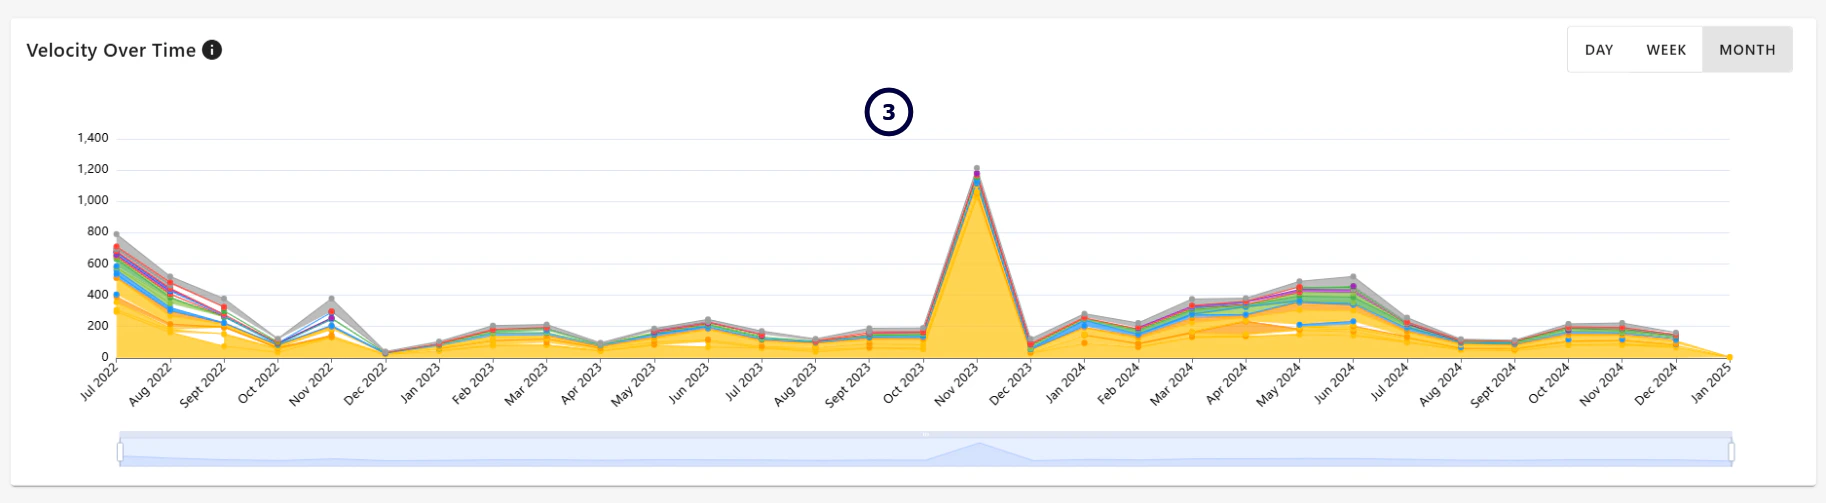
- Velocity Over Time -
- Line chart visualizing activity trends over time, showing the rate at which items are being addressed.
- includes a date slider to narrow the focus of analysis to a specific period of time
- Adjustable views for day, week, or month to provide flexible analysis of activity patterns.